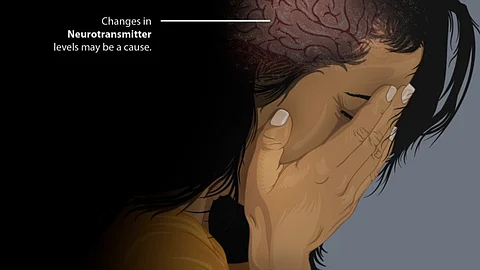

Major depressive disorder is a widespread mental illness, from which suffer about 280 million of people all over the world. Patients lose interest to every kind of activity, face insomnia, sleepiness, weakness, guilt feeling and self-effacement. For detection of depressive disorder people use subjective scales, patients’ reports and observations of a doctor, this all not always enables to diagnose severity of disease precisely. In the last years to improve the diagnostics of mental disorders doctors began to use algorithms of machine education on the base of artificial neuronal webs, similar to those that function in brain. However, attained with their help results are hard to interpret. As a result, it is impossible to segregate main parameters, on the base of which the neuronal web makes decision.
Scientists from the Immanuel Kant Baltic Federal University (Kaliningrad) and Plovdiv Medical University (Bulgaria) suggested the interpretive approach, that enables to find out depressive disorder. To achieve this aim they used photos, attained with the help of functional magnetic resonance tomography – method based on the measurement of intensity of blood flow: when some region of brain activated, blood flow to it increased. Then using the obtained photos researchers constructed graphs – complex networks, in which knots (points) imitated brain regions, and connections between knots – graph edges – reflected cooperation between regions. On the base of attained graphs scientists compared work of brain of 35 patients with depressive disorder and 50 healthy people, and then, using methods of machine education, tried to separate the area of characteristics of both groups.
The suggested approach enabled to distinguish ill and healthy people accurately to within 82.6%. By this groups were differentiated better if authors during their analysis took into account a certain set of network metrics: strength of a knot, correlating the activity of brain region, amount of edges, that is the number of correlations between regions, and also the clustering coefficient, that shows, to what degree knots tend to group together. If researchers applied characteristics separately or added other insignificant network characteristics, algorithm worked incorrect.
Thus, this method enabled to find out those characteristics of functional network of the brain, that differ patients ill from healthy ones. By this the algorithm recognized differences not only in single local connections between brain regions (as it is done by using most methods), but in the global characteristics of all neuronal web.
In future on the base of the attained information we are planning to single out characteristic features of functional nets of brain of healthy people and patients with major depressive disease on different levels of brain. This will enable to choose the most important biomarkers, that are to be analyzed for diagnosing of disease on the base of magnetic resonance tomography.
A Participant of the Project
New method will enable to track global changes in the brain’s structure of people with depressive disorder, and also to provide clinical practice with reliable device for diagnosing this disease.
“In future on the base of the attained information we are planning to single out characteristic features of functional nets of brain of healthy people and patients with major depressive disease on different levels of brain. This will enable to choose the most important biomarkers, that are to be analyzed for diagnosing of disease on the base of magnetic resonance tomography”, – tells the participant of the project, supported by the grant of RSF, Andrey Andreev, candidate of Physical and Mathematical Sciences, senior scholar of the Immanuel Kant Baltic Federal University. (SD/Newswise)
